Zonal statistics with ZonalStats for QGIS
по адресу http://gis-lab.info/qa/zonalstats-qgis-eng.html
Description of the new tool for zonal statistics calculation.
Thematic classification usually followed by an analysis of the results. One of the types of such analysis is zonal statistics calculation.
QGIS laready contains Zonal statistic plugin, that calculates several values (sum, mean value, total count) for pixels by polygonal vector layer. But this plugin don't allow group features by some field, that is necessary when one object is represented by several features. Calculated statistics added to shapefile attributes and this complicates it's usage for further analysis. And also for singleband binary rasters there is no way to get value of used by pixels area.
For this task we developed ZonalStats plugin for opensource GIS QGIS, that allows to calculate zonal statistics and show short report.
This development is part of the project to facilitate monitoring of FSC (Forest Stewardship Council) certified forestry enterprises in Russia.
| Open source geospatial solutions |
Installation notes
Plugin is available via official repository.
ZonalStats is designed for QGIS 1.7.2 or higher and have no additional dependencies.
You can obtain sources from our Git:
git clone https://github.com/nextgis/zonalstats
How does it work
After plugin installation and startup by clicking
main window will appear
At the "Settings" tab you can specify all necessary parameters.
First, select raster layer for analysis from "Raster layer" combobox. Usually this is singleband raster created as result of the thematic classification.
IMPORTANT! Plugin mainly developed to analyze classification results from DTclassifier plugin (0 — feature absence; 1 — feature presence). To use ZonalStats with rasters that have other "encoding" you need to convert them.
Combobox "Polygon layer (zones)" used to select input polygonal vector layer with zones boundaries. Field that will be used for zones labeling selected in "Get zones names from" combobox. If checkbox "Group zones by name" is checked, than zones with identical value of the selected field will be counted as single zone. By default this checkbox is unchecked and each feature treated as single zone.
Field "Save report as" used to select filename for analysis report in HTML format.Additionaly plugin creates CSV file with analysis results that later can be easy loaded in statistical software for further analysis. By default this data file created near the report file, filename is same as for report but with suffix "_data". In you want to save data into another directory tick checkbox "Save data as" and select desired destination.
To start analysis press "OK" button.
ZonalStats counts number of pixels, that corresponds to some class and calculates area used by this class.
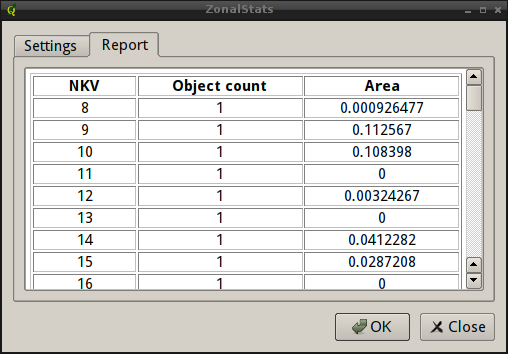
You can view results directly in plugin in the "Report" tab.
Report generated by plugin contains three columns:
- firts column contains zones names (from shape field selected by user)
- "Object count" — number of features in zone. Makes sense, only when groupping is enabled. This column displayed number of features that treated as single zone (number of features with same name)
- "Area" — area used by class. Measurement units depends on layer units (meters, kilometers, feets...)
Contacts
If you want report a bug or want make suggestion — use bugtracker. Also if you have a question about the script or plugin usage, you can contact us directly.
| Open source geospatial solutions |

