Краткое введение в MaxEnt
Автор: Стивен Филлипс (Steven Phillips), AT&T Research
Перевод: Максим Дубинин и надеюсь кто-то еще :)
Это руководство представляет из себя краткое введение в использование программы MaxEnt предназначенной для моделирования географического распространения видов методом максимальной энтропии. Авторы руководства Стивен Филлипс (Steven Phillips), Миро Дудик (Miro Dudik) и Роб Шапир (Rob Schapire), благодаря поддержке AT&T Labs-Research, Университета Принстона и Центр биоразнообразия и охраны природы Американского музея естественной истории (Center for Biodiversity and Conservation, American Museum of Natural History). Более подробное описание теории энтропийного моделирования и описание использованных наборов данных и типов статистического анализ можно найти в следующих статьях:
Steven J. Phillips, Robert P. Anderson and Robert E. Schapire, Maximum entropy modeling of species geographic distributions. Ecological Modelling, Vol 190/3-4 pp 231-259, 2006.
Вторая статья, описывающая относительно новую функциональность ПО Maxent:
Steven J. Phillips and Miroslav Dudik, Modeling of species distributions with Maxent: new extensions and a comprehensive evaluation. Ecography, Vol 31, pp 161-175, 2008.
Используемые данные о параметрах окружающей среды включают климатические и высотные данные по Южной Америке, а также слой потенциальной растительности. Моделируемый вид – Бурогорлый ленивец (Bradypus variegates). Это руководство подразумевает, что все учебные данные расположены в той же папке, где расположен сам Maxent; если это не так – добавляйте свой путь (например, c:\data\maxent\tutorial) к используемым здесь названиям файлов.
Начало
Загрузка
Программное обеспечение включает файл jar, maxent.jar, который может быть запущен на любом компьютере на котором есть версия Java 1.4 или выше. Сам Maxent и документация можно загрузить по адресу www.cs.princeton.edu/~schapire/maxent; Java runtime environment можно получить по адресу java.sun.com/javase/downloads. Если вы используете Microsoft Windows (как мы подразумеваем), то нужно также загрузить файл maxent.bat, and save it in the same directory as maxent.jar. The website has a file called “readme.txt”, which contains instructions for installing the program on your computer.
Запуск
Если вы используете Microsoft Windows, просто щелкните на файле maxent.bat. Если у вас другая операционная система введите в командной строке "java -mx512m -jar maxent.jar" (где "512" можно заменить на количество мегабайт памяти которое вы хотите выделить для программы). Появится такое окно:
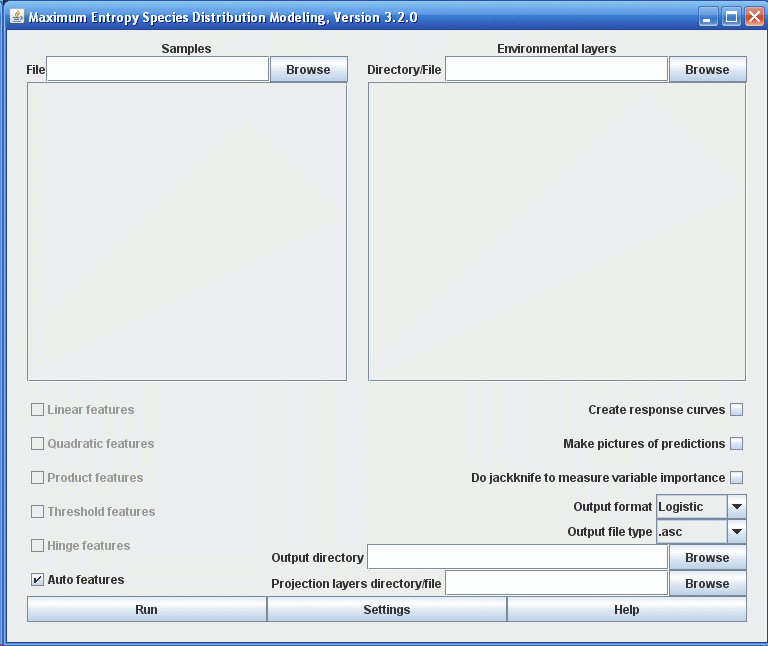
Чтобы запустить процесс, нужно предоставить файл содержащий точки встреч (“samples”), папку содержащую слои с параметрами окружающей среды и выходную папку. В нашем случае точки встреч находятся в файле “samples\bradypus.csv”, слои параметров среды в папке “layers” и выходные результаты будут сохранятся в папке “outputs”. Вы можете вводить эти значения вручную или использовать проводник. Когда вы ищете переменные среды, помните, что нужна папка, которая их содержит, а не сами файлы. После ввода необходимых параметров окно программы должно выглядеть следующим образом:
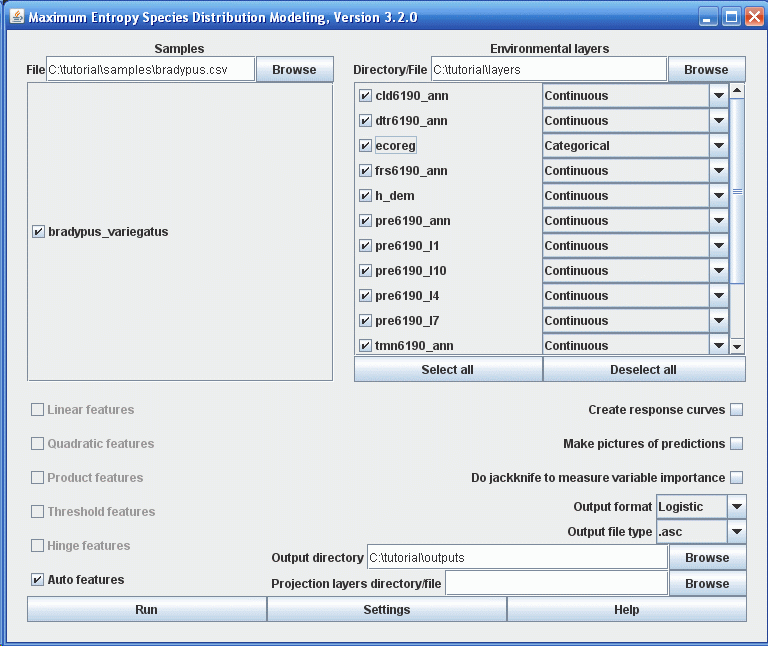
Файл “samples\bradypus.csv” содержит находки в формате .csv. Несколько первых строк выглядят следующим образом:
species,longitude,latitude
bradypus_variegatus,-65.4,-10.3833
bradypus_variegatus,-65.3833,-10.3833
bradypus_variegatus,-65.1333,-16.8
bradypus_variegatus,-63.6667,-17.45
bradypus_variegatus,-63.85,-17.4
В файле находок может быть несколько видов, в этом случае будет сгенерировано больше результатов, кроме Bradypus. Координаты находок могут находиться в системах координат отличных от широта/долгота, но в них должны быть и находки и слои данных. The “x” coordinate (longitude, in our case) should come before the “y” coordinate (latitude) in the samples file. If the presence data has duplicate records (multiple records for the same species in the same grid cell), the duplicates are removed by default; this can be changed by clicking on the “Settings” button and deselecting “Remove duplicate presence records”.
Папка “layers” содержит растровые слои данных в формате ESRI .asc, каждый из которых описывает определенный параметр окружающей среды. The grids must all have the same geographic bounds and cell size (i.e. all the ascii file headings must match each other perfectly). One of our variables, “ecoreg”, is a categorical variable describing potential vegetation classes. The categories must be indicated by numbers, rather than letters or words. You must tell the program which variables are categorical, as has been done in the picture above.
Запуск модели
Просто нажмите кнопку “Run”. Появится индикатор прогресса описывающий текущие шаги выполняемые программой. После загрузки слоев и иннициализации, прогресс тренировки модели максимальной энтропии показывается так:

Прирост (gain) тесно связан с Deviance, которая является мерой качества модели (статистическим критерием) используемой в обобщенных аддитивных и линейных моделях. Прирост начинается с 0 и асимптотически растет в процессе расчета. При расчете Maxent генерирует распределение вероятности ячеек растра, начиная с равномерного распределения и постепенно улучшая соответствие модели данным. Прирост определяется как средняя лог-вероятность образцов присутствия, минус константа, которая делает равным нулю прирост равномерного распределения. В конце прохода, прирост показывает насколько сильно модель сконцентрирована вокруг образцов присутствия; например, если прирост = 2, это означает, что среднее правдоподобие образцов присутствия в exp(2) ≈ 7.4 раз выше, чем у случайных ячеек фона. Отметьте, что Maxent не расчитывает “вероятность присутствия” напрямую. Вероятность, которую Maxent назначает каждой ячейке обычно очень мала, так как значения всех ячеек растра должны в сумме быть равны 1 (мы вернемся к этому моменту, когда будем сравнивать выходные форматы).
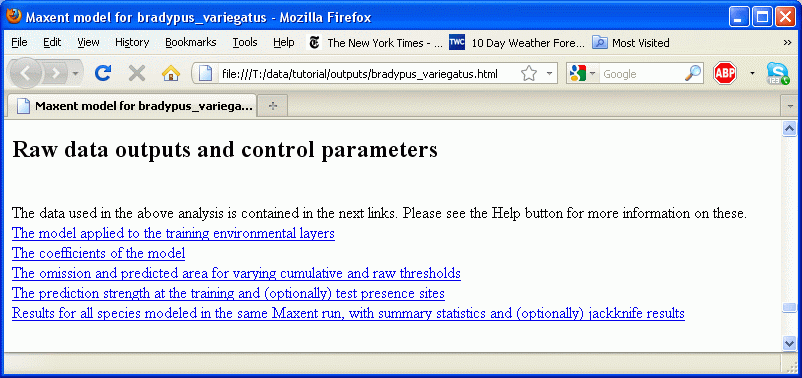
После запуска модели будет создано несколько выходных файлов, основным является “bradypus.html”. В конце этого файла также содержатся ссылки на другие результаты:
Просмотр предсказания
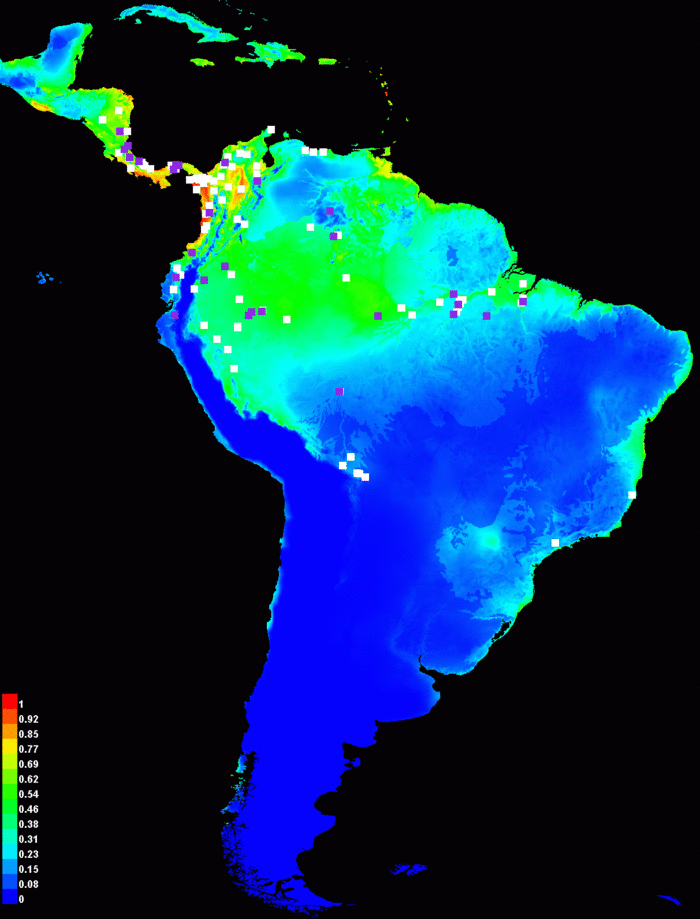
By default, the html output file contains a picture of the model applied to the given environmental data:
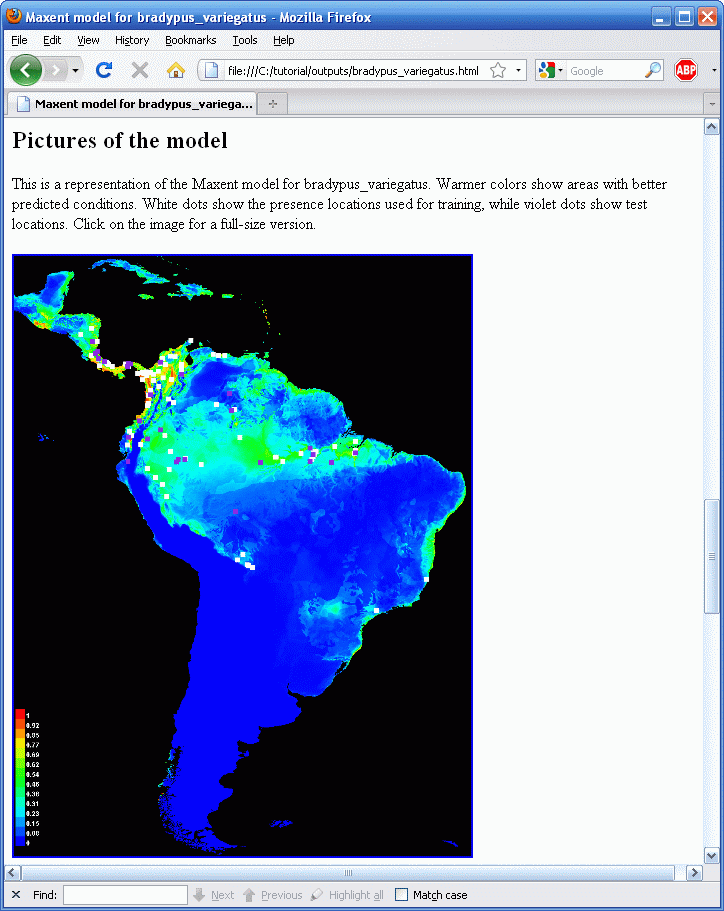
Результирующее изображение цветами показывает расчетную вероятность что условия для находки подходящие, красным показывается высокая вероятность подходящих условий для вида, зеленым – условия похожие на те, в которых находится вид, оттенки синего – маловероятные условия. For Bradypus, we see that suitable conditions are predicted to be highly probable through most of lowland Central America, wet lowland areas of northwestern South America, the Amazon basin, Caribean islands, and much of the Atlantic forests in south-eastern Brazil. The file pointed to is an image file (.png) that you can just click on (in Windows) or open in most image processing software. If you want to copy these images, or want to open them with other software, you will find the .png files in the directory called “plots” that has been created as an output during the run.
Тестовые точки представляют из себя случайную выборку из набора находок. Эта же случайная выборка используется каждый раз при запуске Maxent на одном и том же наборе данных, если не выбрана опция генерации случайной выборки “random seed” в установках. Альтернативно, тестовые данные могут находиться в отдельным файлом и указаны в опции “Test sample file” в настройках.
Выходные форматы
Maxent поддерживает три выходных формата значений модели: исходный, кумулятивный и логистический. Первый, исходный формат представляет из себя саму экспоненциальную модель Maxent. Второе, кумулятивное значение соответствующее исходному значению r – процент распределения Maxent с исходным значением в большинстве r. Кумулятивный выходной формат лучше интерпретировать как предсказываемый уровень омиссии (пропуска): если мы установим кумулятивный порог c, результирующее бинарное предсказание будет иметь уровень омиссии c% при выборке из самого распределения Maxent, и мы можем предсказать такой же уровень омиссии для выборки из распределения вида. Третий формат, если c является экспоненциалом энтропии распределения Maxent, то логичстическое значение соответствующее исходному значению r расчитывается как c·r/(1+c·r). Это логистическая функция, так как исходное значение - экспоненциальная функция переменных среды. Три выходных формата монотонно связаны, но разным образом масштабированы и имеют разную интерпретацию. Выходной формат по умолчанию – логистический, его интерпретировать проще всего: он дает оценку вероятности находки между 0 и 1. Отметьте, что вероятность находки зависит от того, как собирались данные, например размера участка (для мобильных видов), время наблюдения; логистическое значение оценивает вероятность находки подразумевая, что сэмплинг таков, что типичные локации имеют вероятность находки 0.5. Иллюстрация модели Bradypus выше использует логистический формат. Для сравнения, исходный формат даст такое изображение:
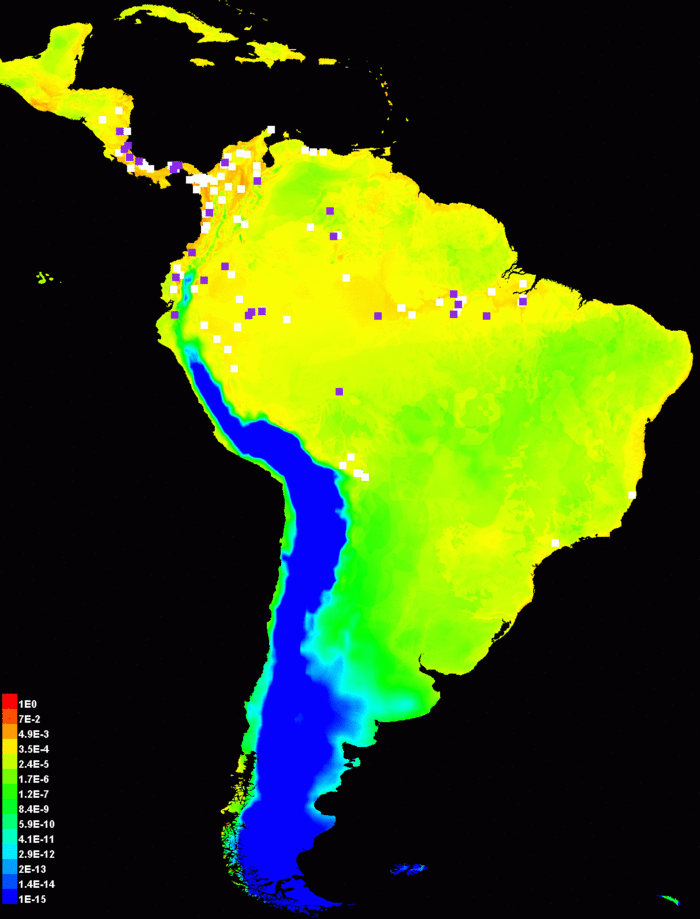
Обратите внимание, что используется логарифмическая шкала цветов. Линейная шкала была бы представлена в основном синими цветами с несколькими красными пикселами (убедиться в этом можно отключив пункт “Logscale pictures” в панели Settings) так как исходные данные обычно имеют небольшое число пунктов с относительно большими значениями – это можно рассматривать как артефакт as an artifact of the raw output being given by an exponential distribution.
Using the cumulative output format gives the following picture:
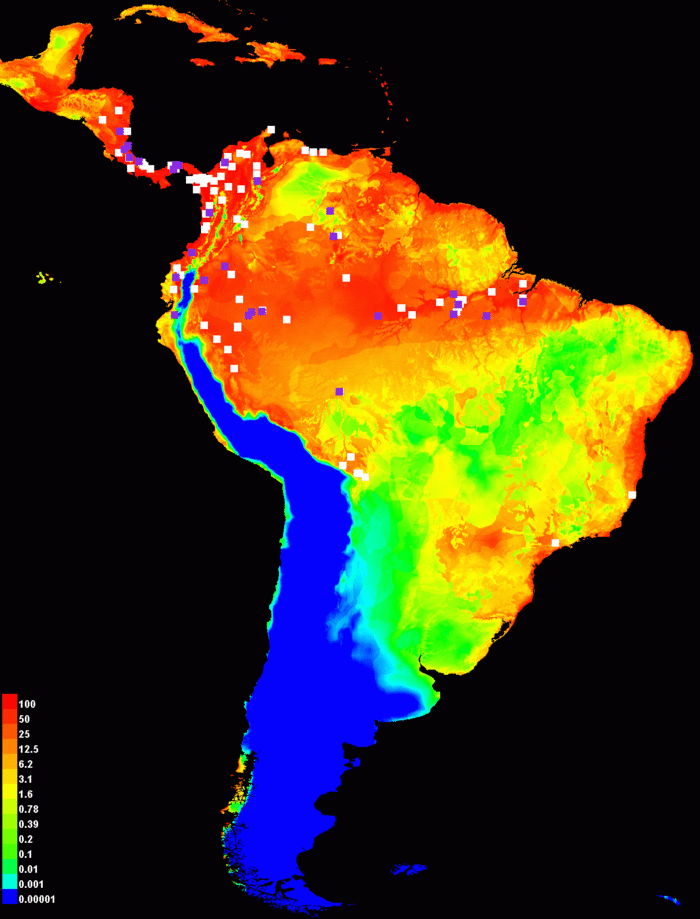
As with the raw output, we have used a logarithmic scale for coloring the picture in order to emphasize differences between smaller values. Cumulative output can be interpreted as predicting suitable conditions for the species above a threshold in the approximate range of 1-20 (or yellow through orange, in this picture), depending on the level of predicted omission that is acceptable for the application.
Статистический анализ
Цифра “25”, которую мы ввели как процент случайных тестовых данных (“random test percentage”) говорит программе, чтобы она случайным образом отобрала 25% находок и отложила их в сторону для тестирования. Это позволяет произвести стастистический анализ точности. Much of the analysis used the use of a threshold to make a binary prediction, with suitable conditions predicted above the threshold and unsuitable below. Первый график показывается как меняется омиссия и предсказанная территория по тестовым и тренировочным точкам в зависимости от кумулятивного порога:
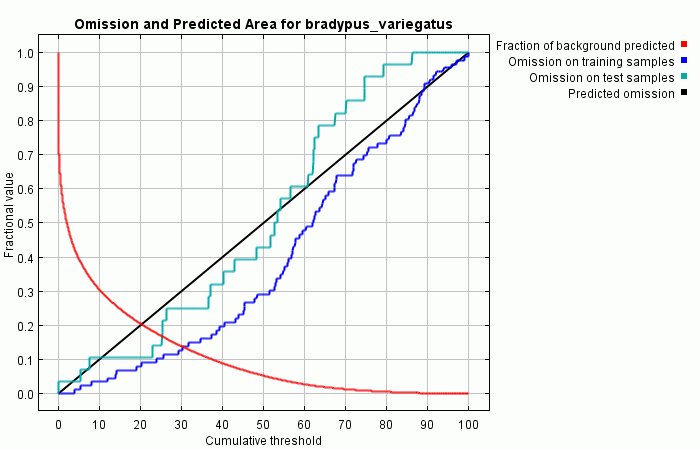
По этому графику можно сказать, что омиссия по тестовым точкам довольно хорошо совпадает с предсказанной динамикой омиссии, рассчитанной для тестовых данных полученных из самого распределения Maxent. Предсказанная омиссия является прямой линией по определению кумулятивного формата. В некоторых ситуациях, линия омиссии по тестовым точкам может лежать ниже предсказанной линии, обычное объяснение этому может заключаться в том, что тестовые и тренировочные данные не независимы, если они например получены из общего автокоррелированного набора данных о находках.
Следующий график (см. ниже) показывает receiver operating curve для тренировочных и тестовых данных. Приведена площадь под кривой ROC (AUC); если есть тестовые данные, ниже на странице отчета можно увидеть стандартную ошибку AUC на тестовых данных.
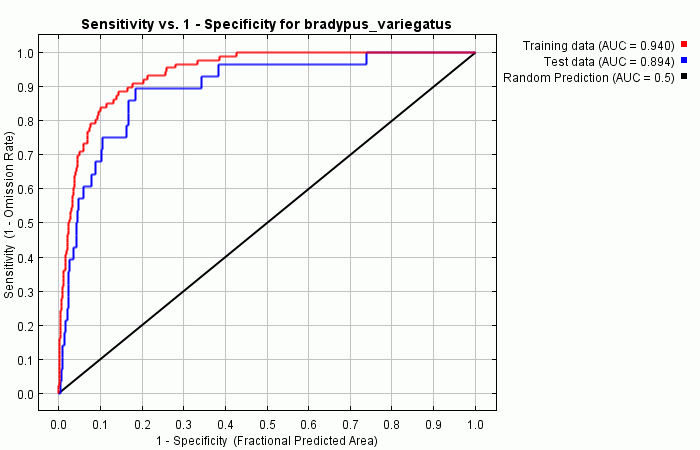
Красный и синий график будут совпадать, если для тренировки и тестирования используются одни и те же данные. Если данные разделены на две части, одна из которых для тренировки, а вторая для тестирования, то красная кривая (тренировка) показывает значение AUC выше, чем синяя (тестирование). Красная кривая показывает насколько хорошо модель описывает тренировочные данные (“fit”). Синяя линия показывает насколько хорошо модель описывает тестовые данные и является реальным тестом предсказательной способности модели. Черная линия показывает ситуацию которую можно было бы ожидать, если бы модель была не лучше случайной. Если синяя линия находится ниже черной, это означает, что модель хуже, чем случайная. Чем ближе к верхнему левому углу находится синяя линия, тем лучше модель предсказывает находки содержащиеся в тестовой выборке. Подробная начальную информацию об AUC можно найти в: Fielding, A.H. & Bell, J.F. (1997) A review of methods for the assessment of prediction errors in conservation presence/absence models. Environmental Conservation 24(1): 38-49. Поскольку у нас есть только данные о находках, но нет данных об отсутствии, вместо ошибки комиссии (доля отсутствующих предсказанная как встречи) используется “fractional predicted area” (доля от площади территории исследования занимаемая встречами. С обсуждением выбора этого показателя можно ознакомиться в статье в Ecological Modelling упоминаемой на первой странице этого руководства. Важно отметить, что значения AUC имеют тенденцию быть выше для видов с небольшими участками относительно территории исследования описываемой слоями данных. Это не обязательно означает, что модель лучше; это артефакт показателя AUC.
If test data are available, the program automatically calculates the statistical significance of the prediction, using a binomial test of omission. For Bradypus, this gives:
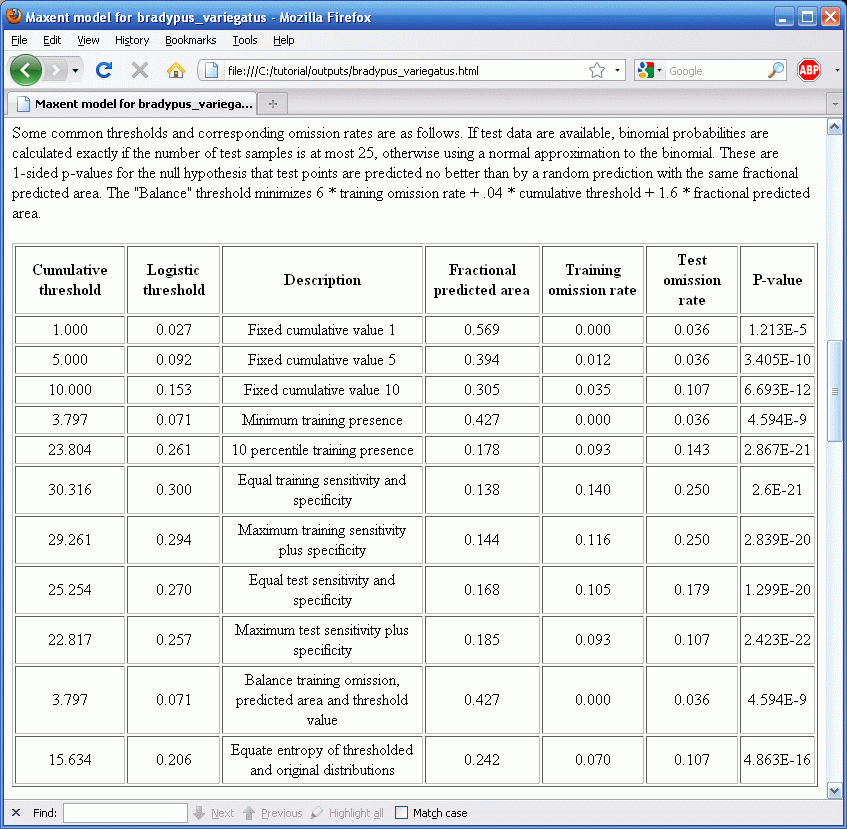
For more detailed information on the binomial statistic, see the Ecological Modelling paper mentioned above.
Какие переменные имеют больший вес?
Естественное применение моделирования – попытка ответить на вопрос, какая из переменных более важна для вида? Существует несколько способов дать ответ на этот вопрос с помощью Maxent.
В процессе тренировки модели Maxent, она отслеживает какие переменные среды вносят вклад в построение модели. Каждый шаг алгоритма Maxent увеличивает прирост модели изменяя коэффициент для одной feature; программа назначает увеличение прироста той переменной или переменным среды, от которой зависит feature. В конце процесса тренировки происходит пересчет приростов в проценты и получается средняя колонка в таблице:
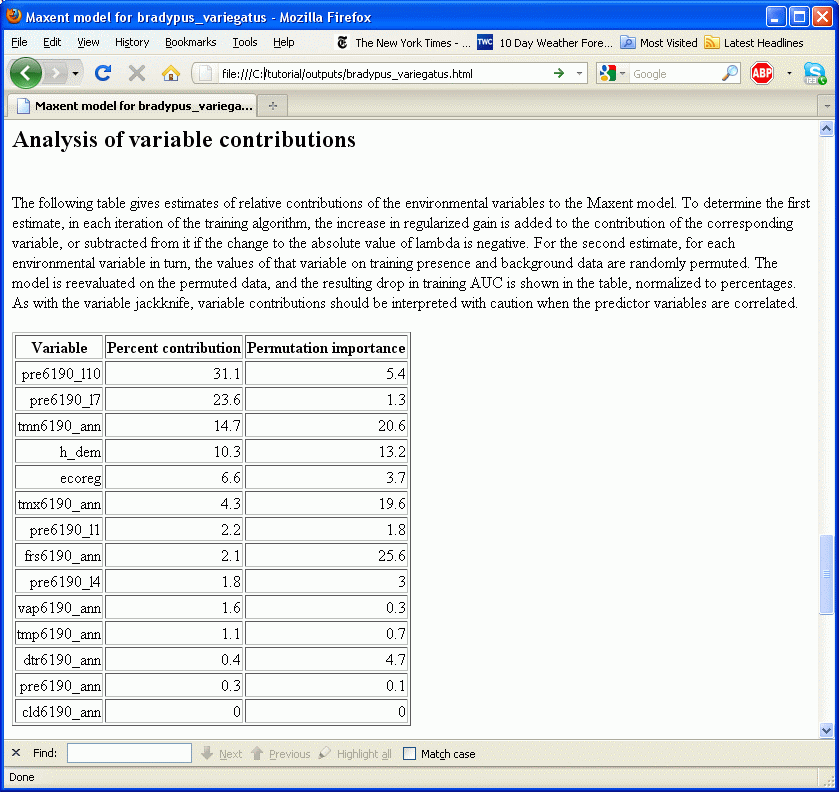
Эти процентные вклады определяются только эвристически и зависят от конкретного пути по которому пошел код Maxent чтобы достичь оптимального решения и другой алгоритм мог бы придти к тому же решению используя другой путь, который бы закончился другими процентами вклада. Дополнительно, если присутствуют сильно скоррелированные переменные, вклад должен интерпретироваться с осторожностью. В нашем примере с Bradypus, годовые осадки сильно скоррелированы с осадками в Октябре и Июле. Хотя таблица выше показывает, что Maxent использовал осадки Октябрь больше чем любую другую переменную и вообще не использовал годовые осадки это не обязательно означает, что осадки в Октябре гораздо более важны для вида чем годовые осадки.
Правая колонка в таблице показывает второй показатель вклада переменной – важность при пермутации (permutation importance). Этот показатель зависит только от окончательной модели, а не пути, который был пройден, чтобы ее получить. Вклад каждой переменной определяется посредством случайного изменения значений этой переменной у тренировочных точек (и находок и фона) и измерения уменьшения тренировочной AUC. Сильное уменьшение свидетельствует о том, что модель сильно зависит от этой переменной. Значения нормализованы, чтобы показывались в процентах.
Альтернативной оценкой важности переменной может быть jackknife-тест, который можно провести включив переключатель “Do jackknife to measure variable important” (Производить jackknife-тест для измерения важности переменной). После нажатия кнопки “Run” (Запуск) создается набор моделей. Каждая переменная исключается в свою очередь и модель создается с остальными переменными. Затем модель создается только с этой переменной. Дополнительно, создается модель со всеми переменными, как раньше. Результаты jackknife-тестов будут показываться в файле “bradypus.html” в виде трех столбчатых диаграмм, первая из них показана ниже.
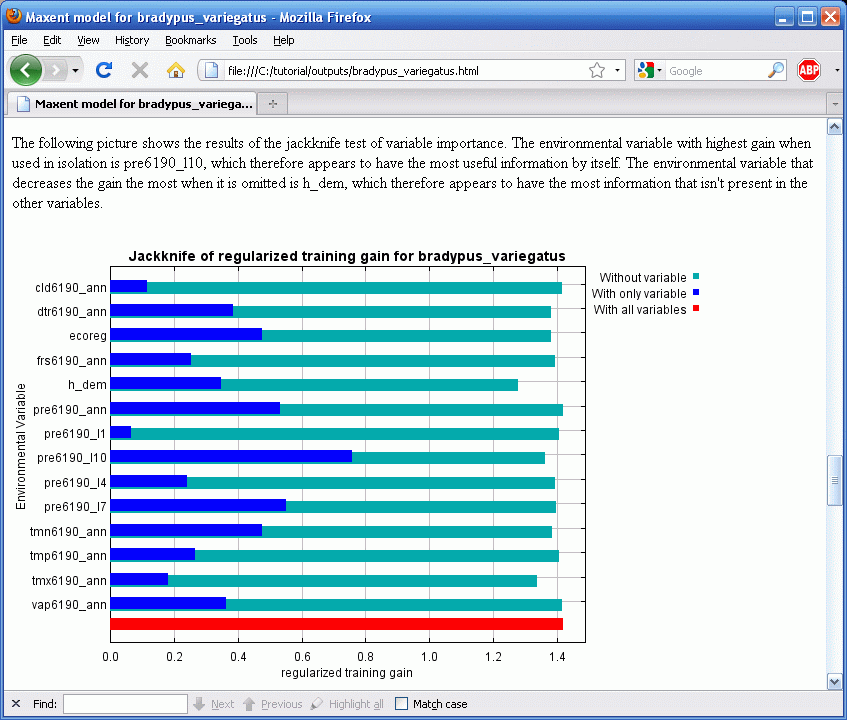
На примере видно, что если Maxent использует только pre6190_l1 (среднее количество осадков в январе) то прироста почти нет, так что, сама по себе эта переменная бесполезна для моделирования распространения Bradypus. С другой стороны, осадки в октябре (pre6190_l10) достаточно хорошо описывают данные. Переключаясь на голубые столбцы, можно отметить, что ни одна из переменных не содержит значительного количества уникальной информации, которая бы не содержалась в других переменных, потому что выключение каждой переменной не привело к значительному уменьшению прироста.
В файле bradypus.html также находятся еще две диаграммы результатов jackknife-теста, показывающих прирост для тестовых данных или AUC, см. ниже:
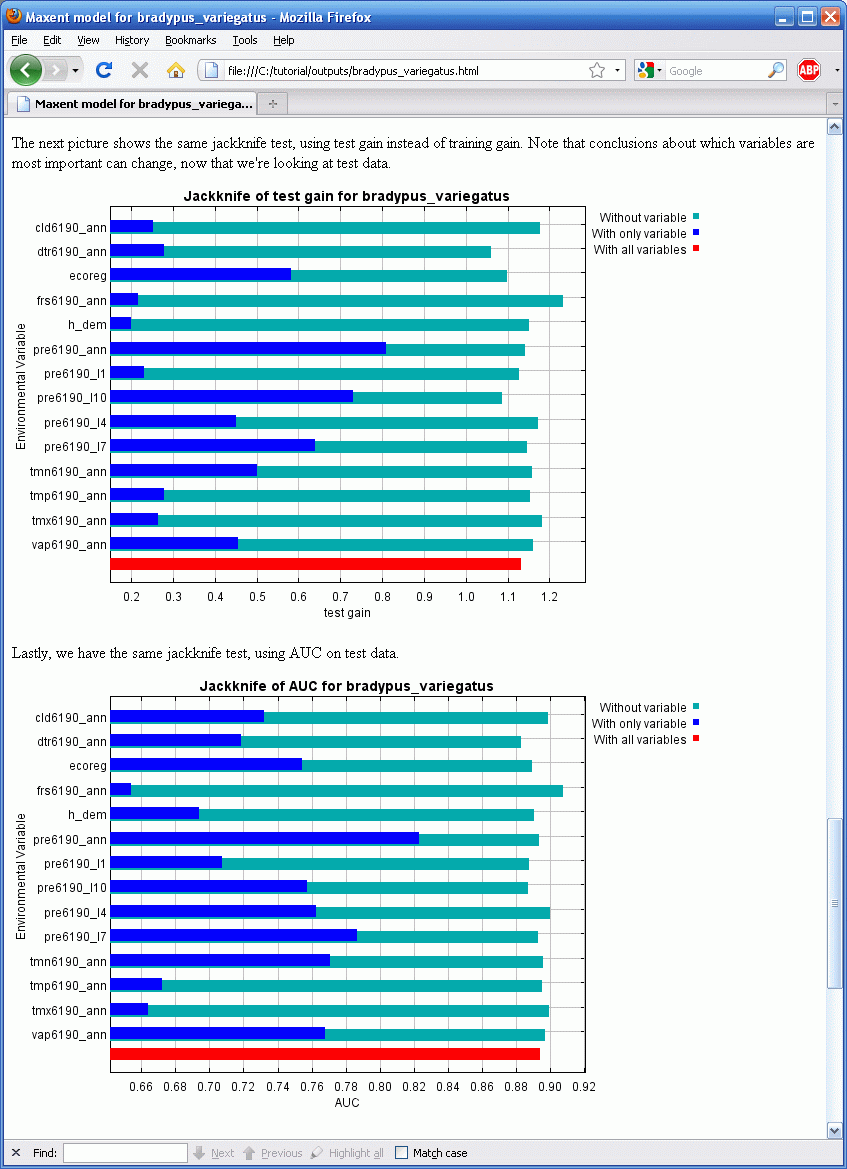
Сравнение диаграмм может быть весьма полезным. Диаграмма AUC показывает, что годовые осадки – переменная наиболее эффективно предсказывающая распределение точек находок которые были выделены в тестовый набор данных, если эффективность предсказания измеряется используя AUC, несмотря на то, что она почти совсем не используется для построения модели когда используются все переменные. Относительная важность годовых осадков также достаточно велика судя по диаграмме прироста по тестовым данным, по сравнению с тренировочными. Дополнительно, эти две диаграммы показывают, что некоторые из светло-голубых столбцов (особенно для месячных осадков) длиннее чем красный столбец, что говорит о том, что предсказательная сила модели увеличивается если эти переменные не используются.
Это говорит нам о том, что переменные месячных осадков помогают Maxent хорошо описать тренировочные данные, но годовые осадки лучше генерализуют, показывая сравнительно лучший результат для отложенных тестовых данных. Другими словами, модели созданные с месячными осадками являются менее переносимыми. Это важно, если нашей целью является перенос модели, например применение ее к будущим климатическим переменным с тем, чтобы оценить будущее распространение вида при условии изменения климата. То, что месячные значения осадков являются менее переносимыми – логично: вероятно, что подходящие местообитания для Bradypus будут зависеть не от точных значений осадков в конкретный месяц, а от общих значений и, возможно, периодичности дождей и отсутствия сухих периодов. При моделировании на континентальном уровне весьма вероятны сдвиги в точном времени сезонных осадков, которые будут влиять на месячные осадки, но не на подходящие условия для Bradypus.
В целом, лучше использовать переменные которые будут вероятнее напрямую связаны с моделируемым видом. Например, вебсайт Worldclim (www.worldclim.org) предоставляет переменные “BIOCLIM”, включающие прозводные, такие как “осадки в четверть с наибольшим их количеством ”, а не просто месячные значения.
Последнее замечание о результатах jackknife-теста: диаграмма прироста с тестовыми данными показывает, что модель созданная только с осадками в январе (pre6190_l1) имеет отрицательный прирост. Это означает, что модель хуже, чем нулевая (т.е., a uniform distribution) дял предсказания распространения находок отложенных для тестирования. Это предоставляет дальнейшие данные о том, что значения месячных осадков не самый лучший выбор для предсказания.
How does the prediction depend on the variables?
Now press the “Create response curves”, deselect the jackknife option, and rerun the model. This results in the following section being added to the “bradypus.html” file:
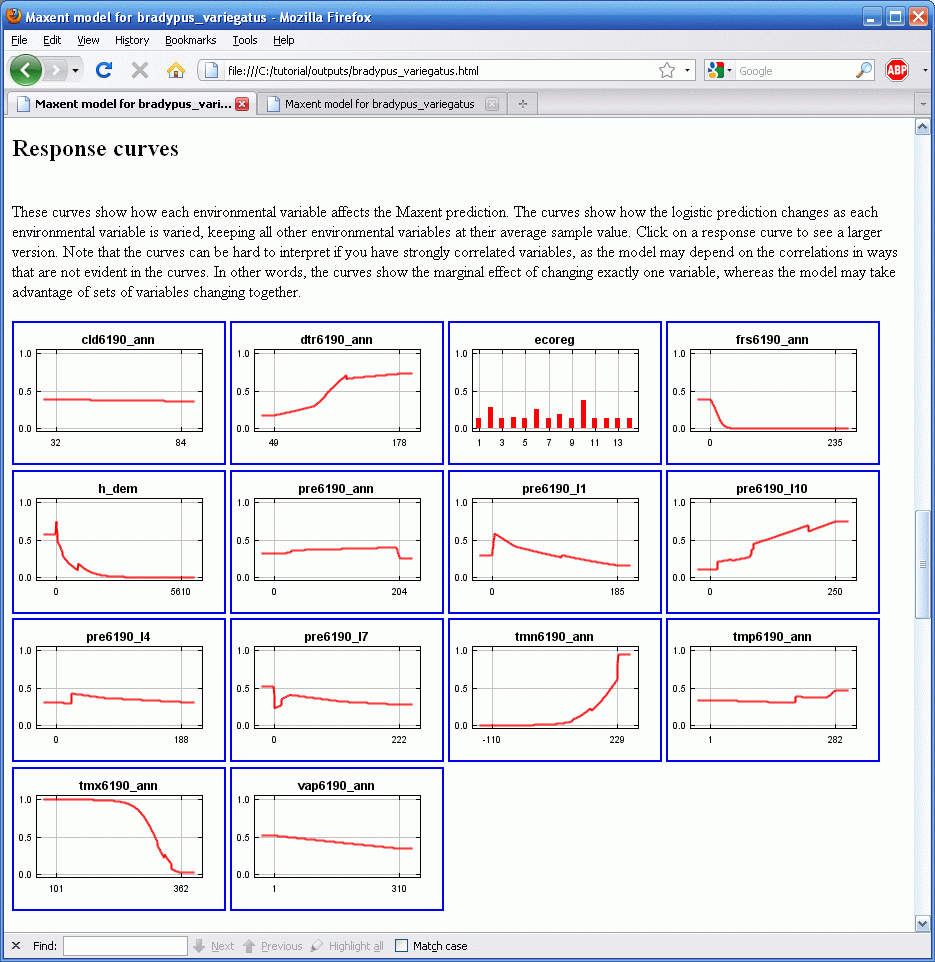
Each of the thumbnail images can be selected (by clicking on them) to obtain a more detailed plot, and if you would like to copy or open these plots with other software, the .png files can be found in the “plots” directory. Looking at vap6190_ann, we see that the response is low for values of vap6190_ann in the range 1-200, and is higher for values in the range 200-300. The value shown on the y-axis is predicted probability of suitable conditions, as given by the logistic output format, with all other variables set to their average value over the set of presence localities.
Note that if the environmental variables are correlated, as they are here, the marginal response curves can be misleading. For example, if two closely correlated variables have response curves that are near opposites of each other, then for most pixels, the combined effect of the two variables may be small. As another example, we see that predicted suitability is negatively correlated with annual precipitation (pre6190_ann), if all other variables are held fixed. In other words, once the effect of all the other variables has already been accounted for, the marginal effect of increasing annual precipitation is to decrease predicted suitability. However, annual precipitation is highly correlated with the monthly precipitation variables, so in reality we cannot easily hold the monthly values fixed while varying the annual value. The program therefore produces a second set of response curves, in which each curve is made by generating a model using only the corresponding variable, disregarding all other variables:
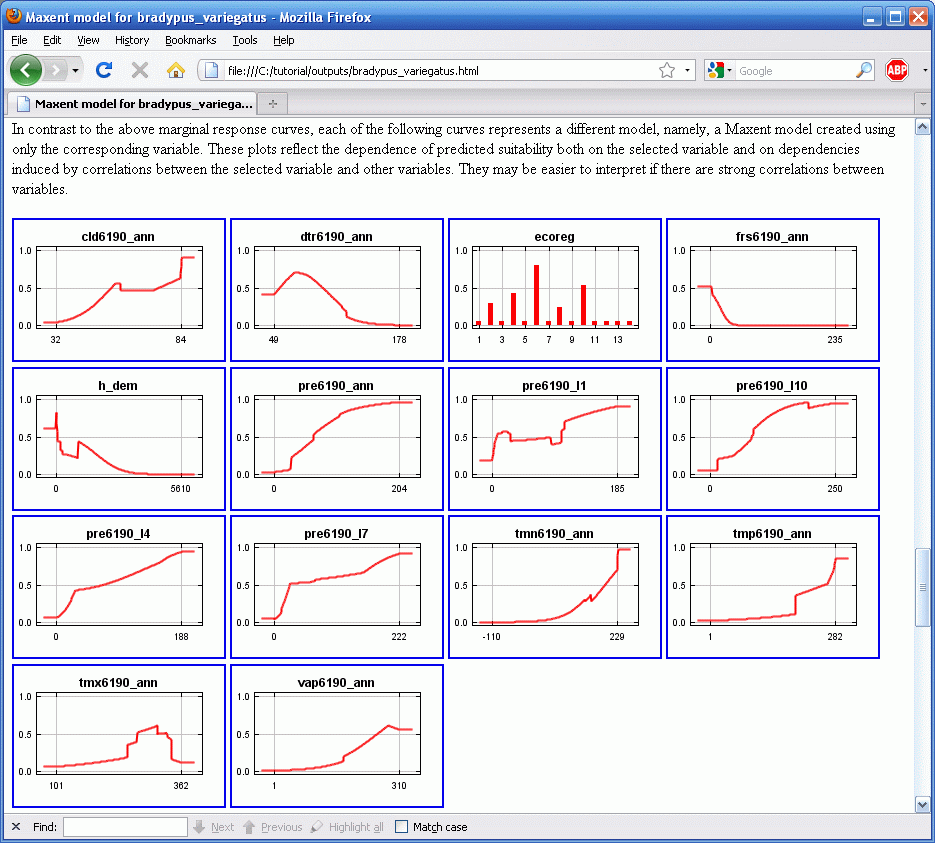
In contrast to the marginal response to annual precipitation in the first set of response curves, we now see that predicted suitability generally increases with increasing annual precipitation.
Типы объектов and кривые зависимостей
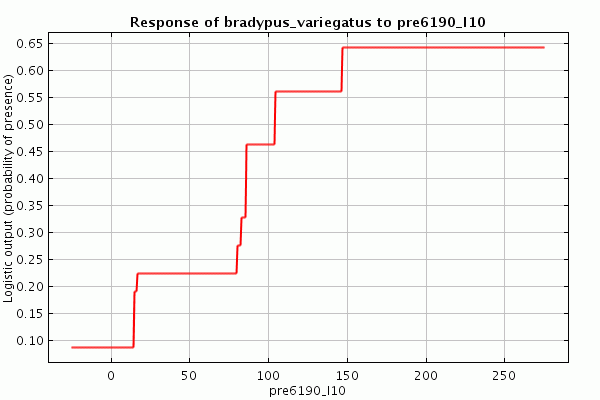
Кривые зависимостей позволяют нам увидеть разницу между различными типами объектов. Отключите авто-объекты (“Auto features”), оставьте выбранными только пороговые объекты (“Threshold features”), и снова нажмите кнопку запуска (“Run”). Посмотрите на результирующий профиль функции – она выгрядит как набор ступенек, например так для переменной 6190_l10:
Теперь попробуйте тоже самое используя только петлевые объекты («hinge features»), результат будет выглядеть примерно так:
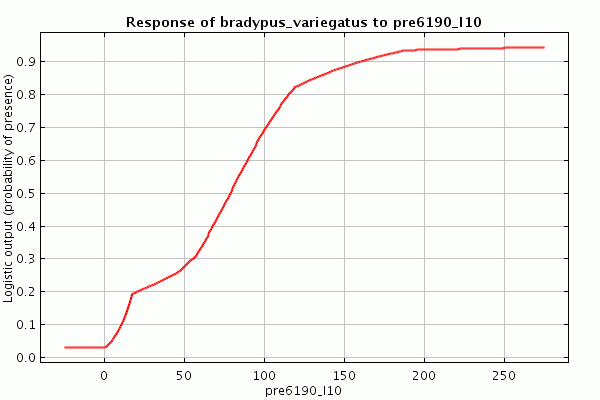
Общий контур двух профилей похож, но в деталях они разные, так как разные типы объектов позволяют разные возможные формы кривых зависимостей. The exponent in a Maxent model is a sum of features, and a sum of threshold features is always a step function, so the logistic output is also a step function (as are the raw and cumulative outputs). In comparison, a sum of hinge features is always a piece-wise linear function, so if only hinge features are used, the Maxent exponent is piece-wise linear. This explains the sequence of connected line segments in the second response curve above. (Note that the lines are slightly curved, especially towards the extreme values of the variable; this is because the logistic output applies a sigmoid function to the Maxent exponent.) Using all classes together (the default, given enough samples) allows many complex responses to be accurately modeled. A deeper explanation of the various feature types can be found by clicking on the help button.
Interactive exploration of predictions: the Explain tool
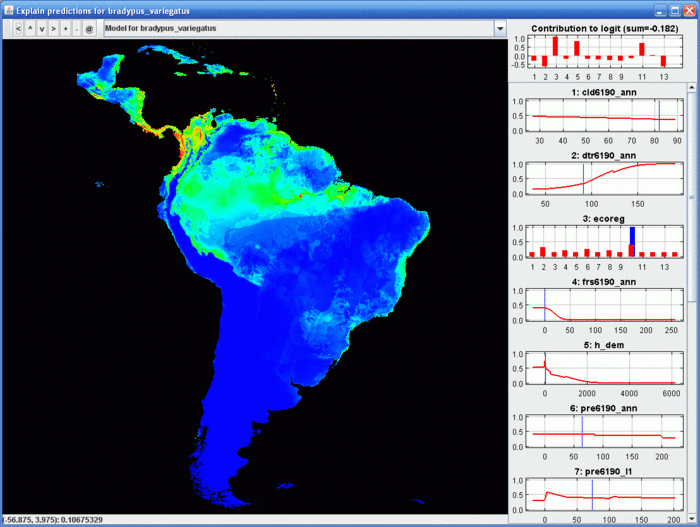
This interactive tool allows you to investigate how Maxent’s prediction is determined by the predictor variables across a study area. Clicking on a point on the map shows its location in each response curve. The top right graph shows how much each variable contributes to the logit of the prediction (pointing at a bar on the graph gives the variable name and numerical contribution). By observing the contributions to the logit, you will see how the Maxent prediction is driven by different variables in different parts of the region.
The tool requires the model to be additive (without interactions between variables), so it should only be run on the output of a runs without product features. Your computer needs enough memory to hold all predictor variables at once. If you do a run without product features, a clickable link to the Explain tool is included after the main picture of the model.
SWD Format
Another input format can be very useful, especially when your environmental grids are very large. For lack of a better name, it’s called “samples with data”, or just SWD. The SWD version of our Bradypus file, called “bradypus_swd.csv”, starts like this:
species,longitude,latitude,cld6190_ann,dtr6190_ann,ecoreg,frs6190_ann,h_dem,pre6190_ann,pre6190_l10,pre6190_l1,pre6190_l4,pre6190_l7,tmn6190_ann,tmp6190_ann,tmx6190_ann,vap6190_ann
bradypus_variegatus,-65.4,-10.3833,76.0,104.0,10.0,2.0,121.0,46.0,41.0,84.0,54.0,3.0,192.0,266.0,337.0,279.0
bradypus_variegatus,-65.3833,-10.3833,76.0,104.0,10.0,2.0,121.0,46.0,40.0,84.0,54.0,3.0,192.0,266.0,337.0,279.0
bradypus_variegatus,-65.1333,-16.8,57.0,114.0,10.0,1.0,211.0,65.0,56.0,129.0,58.0,34.0,140.0,244.0,321.0,221.0
bradypus_variegatus,-63.6667,-17.45,57.0,112.0,10.0,3.0,363.0,36.0,33.0,71.0,27.0,13.0,135.0,229.0,307.0,202.0
bradypus_variegatus,-63.85,-17.4,57.0,113.0,10.0,3.0,303.0,39.0,35.0,77.0,29.0,15.0,134.0,229.0,306.0,202.0
It can be used in place of an ordinary samples file. The difference is only that the program doesn’t need to look in the environmental layers (the ascii files) to obtain values for the variables at the sample points, instead it reads the values for the environmental variables directly from the table. The environmental layers are thus only used to read the environmental data for the “background” pixels – pixels where the species hasn’t necessarily been detected. In fact, the background pixels can also be specified in a SWD format file. The file “background.csv” contains 10,000 background data points. The first few look like this:
background,-61.775,6.175,60.0,100.0,10.0,0.0,747.0,55.0,24.0,57.0,45.0,81.0,182.0,239.0,300.0,232.0
background,-66.075,5.325,67.0,116.0,10.0,3.0,1038.0,75.0,16.0,68.0,64.0,145.0,181.0,246.0,331.0,234.0
background,-59.875,-26.325,47.0,129.0,9.0,1.0,73.0,31.0,43.0,32.0,43.0,10.0,97.0,218.0,339.0,189.0
background,-68.375,-15.375,58.0,112.0,10.0,44.0,2039.0,33.0,67.0,31.0,30.0,6.0,101.0,181.0,251.0,133.0
background,-68.525,4.775,72.0,95.0,10.0,0.0,65.0,72.0,16.0,65.0,69.0,133.0,218.0,271.0,346.0,289.0
We can run Maxent with “bradypus_swd.csv” as the samples file and “background.csv” (both located in the “swd” directory) as the environmental layers file. Try running it – you’ll notice that it runs much faster, because it doesn’t have to load the large environmental grids. Another advantage is that you can associate different records with environmental conditions from different time periods. For example, two occurrences recorded 100 years apart from the same grid cell probably reflect considerable variation in environmental conditions, but unless you use SWD format, both records would be given the same environmental variables values. The downside is that it can’t make pictures or output grids, because it doesn’t have all the environmental data. The way to get around this is to use a “projection”, described below.
Batch running
Sometimes you need to generate multiple models, perhaps with slight variations in the modeling parameters or the inputs. Generation of models can be automated with command-line arguments, obviating the need to click and type repetitively at the program interface. The command line arguments can either be given from a command window (a.k.a. shell), or they can be defined in a batch file. Take a look at the file “batchExample.bat” (for example, right click on the .bat file inWindows Explorer and open it using Notepad). It contains the following line:
java -mx512m -jar maxent.jar environmentallayers=layers togglelayertype=ecoreg samplesfile=samples\bradypus.csv outputdirectory=outputs redoifexists autorun
The effect is to tell the program where to find environmental layers and samples file and where to put outputs, to indicate that the ecoreg variable is categorical. The “autorun” flag tells the program to start running immediately, without waiting for the “Run” button to be pushed. Now try double clicking on the file to see what it does.
Many aspects of the Maxent program can be controlled by command-line arguments – press the “Help” button to see all the possibilities. Multiple runs can appear in the same file, and they will simply be run one after the other. You can change the default values of parameters by adding command-line arguments to the “maxent.bat” file. Many of the command-line arguments also have abbreviations, so the run described in batchExample.bat could also be initiated using this command:
java -mx512m -jar maxent.jar –e layers –t eco –s samples\bradypus.csv –o outputs –r -a
Репликация
Опция репликации ("replicates") может быть использована для того, чтобы несколько раз повторить модель для одного и того же вида. Наиболее распространенное применение – сэмплирование и кросс-валидация. Управлять репликацией можно либо из панели Настройки (Settings), либо через параметры командной строки. По умолчанию при репликации используется кросс-валидация, во время которой точки встреч разбиваются на группы равного размера, так называемые “folds”, и модель создается по каждому из них отдельно. Оставшиеся folds потом используются для оценки. Кросс-валидация имеет одно большое преимущество перед единичным разбиением на тренировочный-тестовый набор: она использует все данные для валидации, что хорошо для небольших наборов данных. As an example, doing a run with the number of replicates set to 10 creates 10 html pages, plus a page that summarizes statistical information for the cross-validation. For example, we get ROC curves with error bars and average AUC across models, and summary response curves with one standard deviation error bars. For Bradypus, the cross-validated ROC curve shows some variability between models:
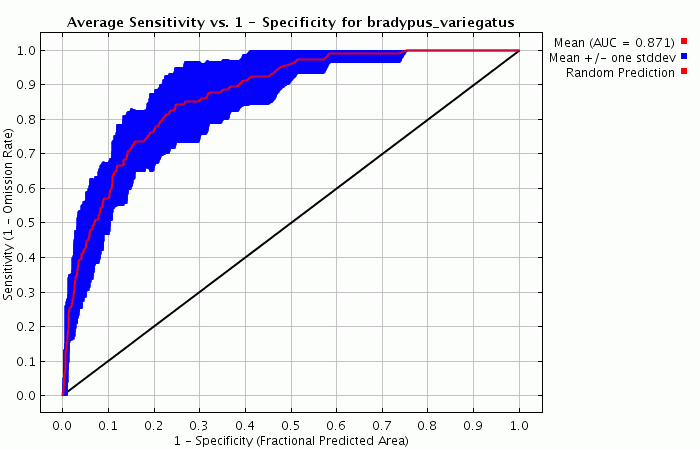
The single-variable response of Bradypus to annual precipitation shows little variation (on the left, below), while the marginal response to annual precipitation is more variable (below, right).
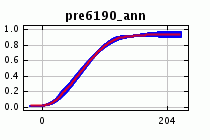
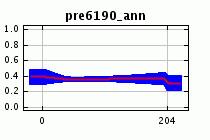
Two alternative forms of replication are supported: repeated subsampling, in which the presence points are repeatedly split into random training and testing subsets, and bootstrapping, where the training data is selected by sampling with replacement from the presence points, with the number of samples equaling the total number of presence points. With bootstrapping, the number of presence points in each set equals the total number of presence points, so the training data sets will have duplicate records.
With all three forms of replication, you may want to avoid eating up disk space by turning off the “write output grids” option, which will suppress writing of output grids for the replicate runs, so that you only get the summary statistics grids (avg, stderr etc.).
Regularization
The “regularization multiplier” parameter on the settings panel affects how focused or closely-fitted the output distribution is – a smaller value than the default of 1.0 will result in a more localized output distribution that is a closer fit to the given presence records, but can result in to overfitting (fitting so close to the training data that the model doesn’t generalize well to independent test data). A larger regularization multiplier will give a more spread out, less localized prediction. Try changing the multiplier, and examine the pictures produced and changes in the AUC. As an example, setting the multiplier to 3 makes the following picture, showing a much more diffuse distribution than before:
The potential for overfitting increases as the model complexity increases. First try setting the multiplier very small (e.g. 0.01) with the default set of features to see a highly overfit model. Then try the same regularization multiplier with only linear and quadratic features.
Предсказание
Модель, созданная на одном наборе слоёв (или файле SWD) может быть “спроецирована” путем ее применения к другому набору слоёв (или файлу SWD). Situations where projections are needed include modeling species distributions under changing climate conditions, applying a model of the native distribution of an invasive species to assess invasive risk in a different geographic area, or simply evaluating the model at a set of test locations in order to do further statistical analysis. Here we’re going to use projection for a simplistic climate change prediction, and to give a taste of the difficulties involved in making reliable predictions of distributions under climate change.
The directory “hotlayers” has the same environmental data as the “layers” directory, with two changes: the annual average temperature variable (tmp6190_ann.asc) has all values increased by 30, representing a uniform 3 degree Celsius increase, while the maximum temperature variable (tmx6190_ann.asc) has all values increased by 40, representing a 4 degree Celsius increase. These changes represent a very simplified estimate of future climate, with higher average temperature and higher temperature variability, but with no change in precipitation. To apply a model of Bradypus to this new climate, enter the samples file and current environmental data as before, using either grids or SWD format, and enter the “hotlayers” directory in the “Projection Layers Directory”, as pictured below.
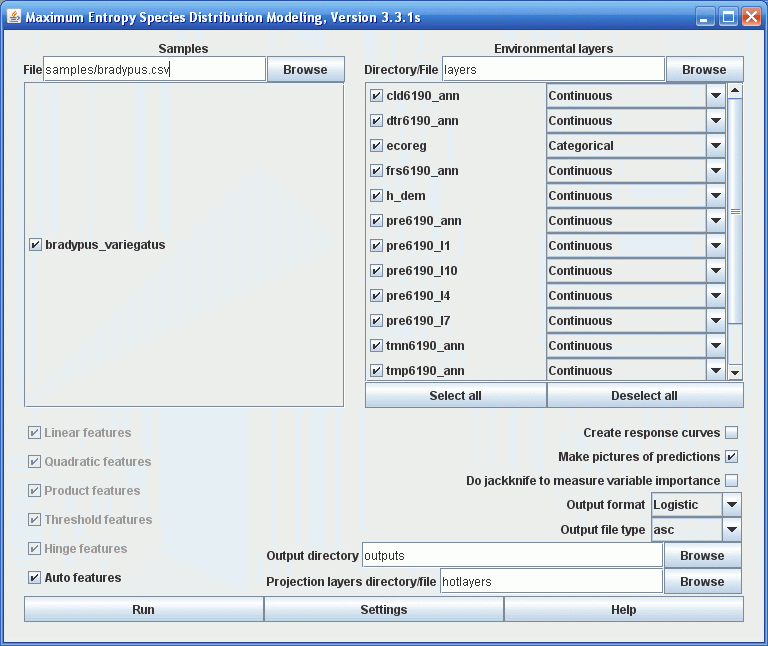
The projection layers directory (or SWD file) must contain variables with the same names as the variables used for training the model, but describing a different conditions (e.g., a different geographic region or different climatic model). For both the training and projection data, each variable name is either the column title (if using an SWD format file) or the filename without the .asc file ending (if using a directory of grids).
When you press “Run”, a model is trained on the environmental variables corresponding to current climate conditions, and then projected onto the ascii grids in the “hotlayers” directory. The output ascii grid is called “bradypus_variegatus_hotlayers.asc”, and in general, the projection directory name is appended to the species name, in order to distinguish it from the standard (un-projected) output. If “make pictures of predictions” is selected, a picture of the projected model will appear in the “bradypus.html” file. In our case, this produces the following picture:
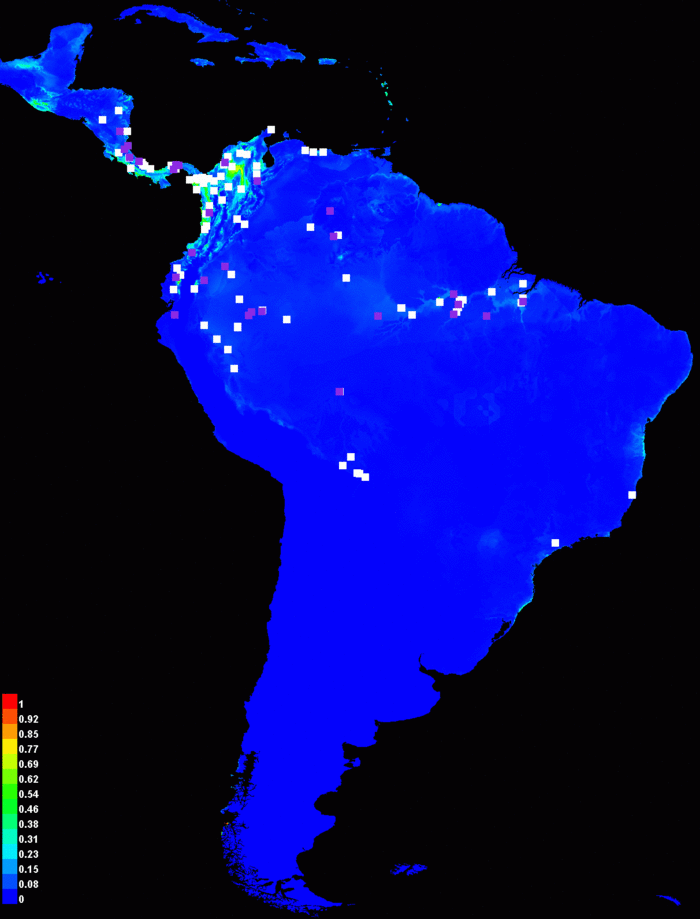
We see that the predicted probability of presence is drastically lower under the warmer climate. The prediction is of course dependent on the parameters of the model we’re projecting. If we use only hinge and categorical features, rather than the default set of features, the projected distribution is more substantial:
Two different models that look very similar in the area used for training may look very different when projected to a new geographic area or new climate conditions. This is especially true if there are correlated variables that allow a variety of ways to fit similar-looking models, since the correlations between the variables may change in the area you’re projecting to.
Is the predicted range reduction of Bradypus under climate change reasonable? If we look at the marginal response curves for the model made with default features, we see that the maximum temperature is exerting a much stronger influence on the prediction:
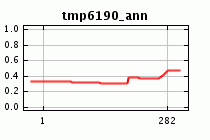
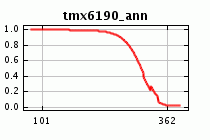
Looking at a histogram of maximum temperature values at the known occurrences for Bradypus, we see that most occurrences (about 80%) have maximum temperature between 30 and 34 degrees Celsius. Only a single occurrence is above 34 degrees, even though a significant fraction of the background is between 34 and 35 degrees.
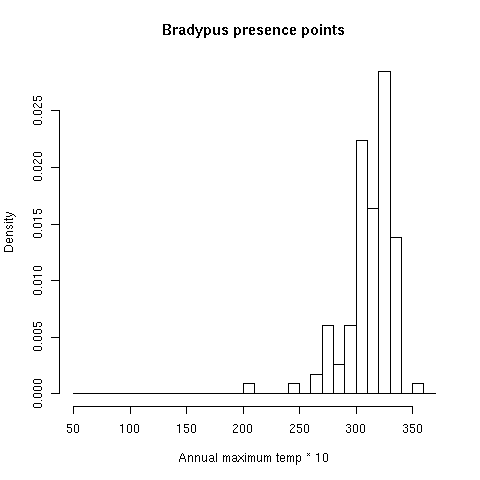
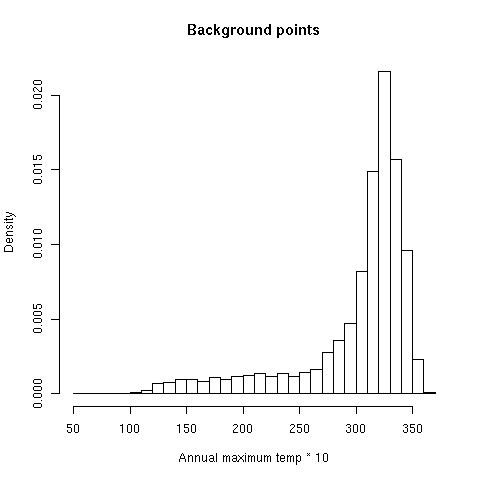
Under our climate change prediction, all 80% of the Bradypus locations currently above 30 degrees will have the maximum temperature increase to above 34 degrees. Therefore it may indeed be reasonable to predict that such locations will not be suitable for Bradypus, so Bradypus might not survive in most of its current range. Note that it is difficult to make any conclusions about why such conditions are not suitable: it may be that Bradypus is intolerant to heat, or it may be that higher maximum temperatures would allow fire to cause widespread replacement of rainforest by fire-tolerant tree species, eliminating most suitable habitat for Bradypus. To further investigate the prospects of Bradypus under climate change, we could do physiological studies to investigate the species’ tolerance for heat, or study the fire ecology of rainforest boundaries in the region.
Note: histograms like the two above are useful tools for investigating your data. They were made in R using the following commands:
swdPresence <- read.csv("swd/bradypus_swd.csv")
hist(swdPresence$tmx6190_ann, probability=TRUE, breaks=c(5:37*10), xlab="Annual maximum temp * 10", main="Bradypus presence points")
swdBackground <- read.csv("swd/background.csv")
hist(swdBackground$tmx6190_ann, probability=TRUE, breaks=c(5:37*10), xlab="Annual maximum temp * 10", main="Background points")
We can see from the histograms that Bradypus can occasionally tolerate high temperatures, as evidenced by the single record with maximum temperature of 35 degrees. On the other had, there are extremely few points in the background with temperatures of 36 or above, so we have no evidence of whether or not Bradypus can tolerate even higher temperatures, which will be widespread under the future climate prediction. This is known as the problem of novel climate conditions: when projecting, the predictor variables may take on values outside the range seen during model training. The primary way Maxent deals with this problem is “clamping”, which treats variables outside the training range as if they were at the limit of the training range. This effect can be seen in the response curves described above, as the response is held constant outside the training range. Whenever a model is projected, Maxent makes a picture that shows where clamping has had a large effect. Projecting the Bradypus model made with all features gives this clamping picture, where the values depicted are the absolute difference between predictions with and without clamping.
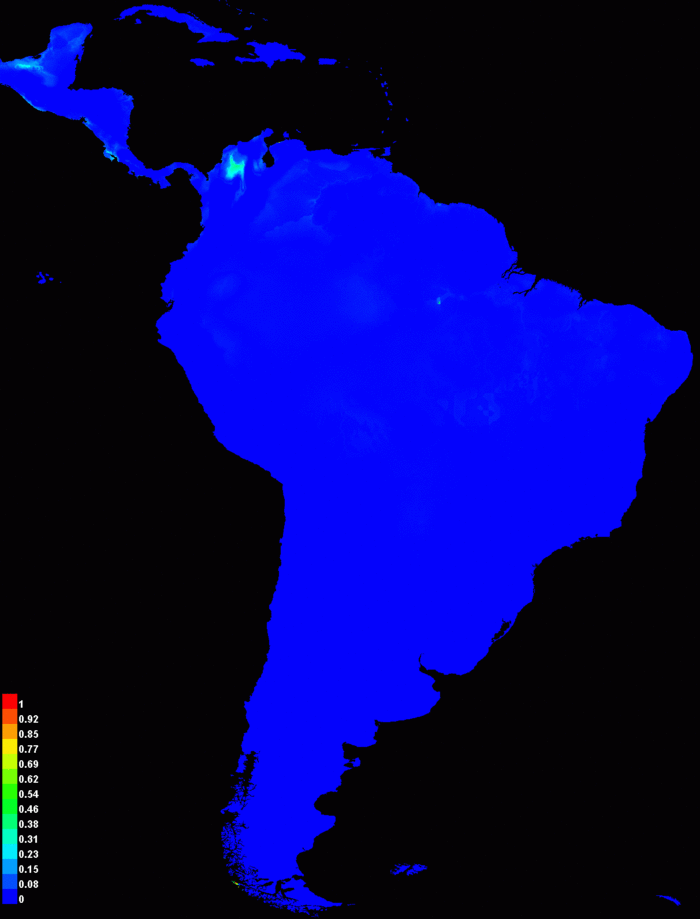 ]
]Clamping has clearly had little effect in this case – in particular, the response curve for maximum temperature above shows that the prediction had already leveled off near zero at the hot end of the scale, so clamping has little effect.
We also compare the environmental variables used for projection to those used for training the model. After the clamping map, we see the following two pictures:
 ]
]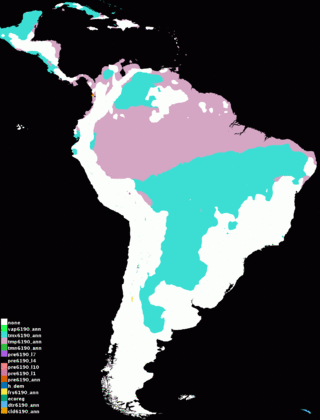 ]
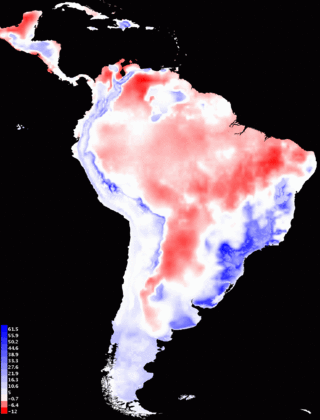
]The leftmost picture is a multivariate similarity surface (MESS), as described in Elith et al., Methods in Ecology and Evolution, 2010. It shows how similar each point is in hotlayers to conditions seen during model training. Negative values (shown in red) indicate novel climate, i.e., hotlayers values outside the range in layers. The value shown is the minimum over the predictors of how far out of range the point is, expressed as a fraction of the range of that predictor’s values in layers. Positive values (shown in blue) are similar to BIOCLIM values, with a score of 100 meaning that a point is not at all novel, in the sense that its hotlayers values are all exactly equal to the median value in layers. The picture on the right shows the most dissimilar variable (MoD), and as we would expect, it shows that novel climate conditions in hotlayers are due to average temperature (mauve, mostly north of the Amazon River) or maximum temperature (teal blue, mostly south of the Amazon) being outside of the training range.
Additional command-line tools
The Maxent jar file contains a number of tools that can be accessed from the command line. For Microsoft users: the features described here can be used in a batch file, like maxent.bat. As an alternative, Start->run->cmd gets you a shell for running commands interactively; cygwin (available free online) is a good alternative with a much more powerful shell that offers many unix utilities.
Quick visualization of grid file
Grid files in .asc, .grd and .mxe format, and some files in .bil format, can be viewed using the following command:
java -mx512m -cp maxent.jar density.Show filename
As with all the commands described below, you may need to add the path to the maxent.jar file and/or the file you want to view. For example, you might use:
java -mx1000m -cp C:\maxentfiles\maxent.jar density.Show C:\mydata\var1.asc
Show can take some optional arguments (immediately after density.Show):
-s sampleFile gives a file with presences to be shown in white dots
-S speciesname says which species in the sampleFile to show with dots
-r radius controls the size of the white and purple dots for occurrence records
-L removes the legend
-o writes the picture to a file in .png format
With a little Windows wizardry, you can make Show be invoked just by clicking on .asc, .grd or .mxe files. Make a batch file, say called showFile.bat, with the following single line in it:
java -mx512m -cp "c:\maxentfiles\maxent.jar" density.Show %1
then associate files of type .asc, .grd or .mxe with the batch file: from a windows explorer (a.k.a. "My Computer"), Tools->Folder Options->File Types... You may need to make the batch file executable: right click on it and follow directions.
Making an SWD file
To make an SWD-format file from a non-SWD file:
java -cp maxent.jar density.Getval samplesfile grid1 grid2 ...
where samplesfile is .csv file of occurrence data and grid1, grid2, etc. are grids in .asc, .mxe, .grd or .bil format. The output is written to "standard output", which means it appears in the command window. To write the output to a file, use a "redirect":
java -cp maxent.jar density.Getval samplesfile grid1 grid2 ... > outfile
If all the grids are in a directory you can avoid having to list them all by name by using a "wildcard":
java -cp maxent.jar density.Getval samplesfile directory/*.asc ... > outfile
because the wildcard (*) gets expanded to a list of all files that match.
Making an SWD background file
To pick a collection of background points uniformly at random from your study area:
java -cp maxent.jar density.tools.RandomSample num grid1 grid2 ...
where "num" is the number of background points desired.
Calculating AUC
The following command:
java -cp maxent.jar density.AUC testpointfile predictionfile
will calculate a presence-background AUC, where the presence points are given in the testpointfile and background points are drawn randomly from the predictionfile. The testpointfile is a .csv file (which may optionally be swd format), while the predictionfile is a grid file, typically representing the output of a species distribution model.
Projection
This tool allows you to apply a previously-calculated Maxent model to a new set of environmental data:
java -cp maxent.jar density.Project lambdaFile gridDir outFile [args]
Here lambdaFile is a .lambdas file describing a Maxent model, and gridDir is a directory containing grids for all the predictor variables described in the .lambdas file. As an alternative, gridDir could be an swd format file. The optional args can contain any flags understood by Maxent -- for example, a "grd" flag would make the output grid of density.Project be in .grd format.
File conversion
To convert a directory full of grids in one format to another:
java -cp maxent.jar density.Convert indir insuffix outdir outsuffix
where indir and outdir are directories and insuffix and outsuffix are one of asc, mxe, grd or bil.
Analyzing Maxent output in R
Maxent produces a number of output files for each run. Some of these files can be imported into other programs if you want to do your own analysis of the predictions. Here we demonstrate the use of the free statistical package R on Maxent outputs: this section is intended for users who have experience with R. We will use the following two files produced by Maxent:
bradypus_variegatus_backgroundPredictions.csv
bradypus_variegatus_samplePredictions.csv
The first file is only produced when the “writebackgroundpredictions” option is turned on, either by using a command-line flag or by selecting it from Maxent’s settings panel. The second file is always produced. Make sure you have test data (for example, by setting the random test percentage to 25); we will be evaluating the Maxent outputs using the same test data Maxent used. First we start R, and install some packages (assuming this is the first time we’re using them) and then load them by typing (or pasting):
install.packages("ROCR", dependencies=TRUE)
install.packages("vcd", dependencies=TRUE)
library(ROCR)
library(vcd)
library(boot)
Throughout this section we will use blue text to show R code and commands and green to show R outputs. Next we change directory to where the Maxent outputs are, for example:
setwd("c:/maxent/tutorial/outputs")
and then read in the Maxent predictions at the presence and background points, and extract the columns we need:
presence <- read.csv("bradypus_variegatus_samplePredictions.csv")
background <- read.csv("bradypus_variegatus_backgroundPredictions.csv")
pp <- presence$Logistic.prediction </nowiki># get the column of predictions
testpp <- pp[presence$Test.or.train=="test"] # select only test points
trainpp <- pp[presence$Test.or.train=="train"] <nowiki># select only test points
bb <- background$logistic
Now we can put the prediction values into the format required by ROCR, the package we will use to do some ROC analysis, and generate the ROC curve:
combined <- c(testpp, bb) </nowiki># combine into a single vector
label <- c(rep(1,length(testpp)),rep(0,length(bb))) # labels: 1=present, 0=random
pred <- prediction(combined, label) <nowiki># labeled predictions
perf <- performance(pred, "tpr", "fpr") # True / false positives, for ROC curve
plot(perf, colorize=TRUE) <nowiki># Show the ROC curve
performance(pred, "auc")@y.values[[1]] # Calculate the AUC
The plot command gives the following result:
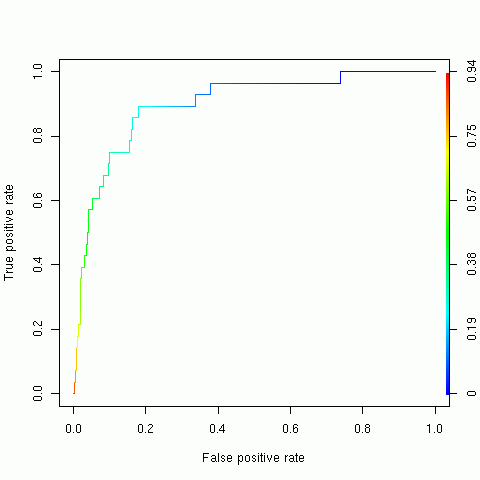
while the “performance” command gives an AUC value of 0.8677759, consistent with the AUC reported by Maxent. Next, as an example of a test available in R but not in Maxent, we will make a bootstrap estimate of the standard deviation of the AUC.
AUC <- function(p,ind) { pres <- p[ind] combined <- c(pres, bb) label <- c(rep(1,length(pres)),rep(0,length(bb))) predic <- prediction(combined, label) return(performance(predic, "auc")@y.values1) }
b1 <- boot(testpp, AUC, 100) # do 100 bootstrap AUC calculations
This gives the following output:
ORDINARY NONPARAMETRIC BOOTSTRAP

Call:
boot(data = testpp, statistic = AUC, R = 100)

Bootstrap Statistics :

original bias std. error
t1* 0.8677759 -0.0003724138 0.02972513
and we see that the bootstrap estimate of standard error (0.02972513) is close to the standard error computed by Maxent (0.028). The bootstrap results can also be used to determine confidence intervals for the AUC:
boot.ci(b1)
gives the following four estimates – see the resources section at the end of this tutorial for references that define and compare these estimates.
Intervals :
Level Normal Basic
95% ( 0.8099, 0.9264 ) ( 0.8104, 0.9291 )

Level Percentile BCa
95% ( 0.8064, 0.9252 ) ( 0.7786, 0.9191 )
Those familiar with use of the bootstrap will notice that we are bootstrapping only the presence values here. We could also bootstrap the background values, but the results would not change much, given the very large number of background values (10000).
As a final example, we will investigate the calculation of binomial and Cohen’s Kappa statistics for some example threshold rules. First, the following R code calculates Kappa for the threshold given by the minimum presence prediction:
confusion <- function(thresh) {
return(cbind(c(length(testpp[testpp>=thresh]), length(testpp[testpp<thresh])),c(length(bb[bb>=thresh]), length(bb[bb<thresh]))))
}
mykappa <- function(thresh) {
return(Kappa(confusion(thresh)))
}
mykappa(min(trainpp))
which gives a value of 0.0072. If we want to use the threshold that minimizes the sum of sensitivity and specificity on the test data, we can do the following, using the true positive rate and false positive rate values from the “performance” object used above to plot the ROC curve:
fpr = perf@x.values[[1]]
tpr = perf@y.values[[1]]
sum = tpr + (1-fpr)
index = which.max(sum)
cutoff = perf@alpha.values[[1]][[index]]
mykappa(cutoff)
This gives a kappa value of 0.0144. To determine binomial probabilities for these two threshold values, we can do:
mybinomial <- function(thresh) { conf <- confusion(thresh) trials <- length(testpp) return(binom.test(conf11, trials, conf1,2 / length(bb), "greater")) }
mybinomial(min(trainpp))
mybinomial(cutoff)
This gives p-values of 5.979e-09 and 2.397e-11 respectively, which are both slightly larger than the p-values given by Maxent. The reason for the difference is that the number of test samples is greater than 25, the threshold above which Maxent uses a normal approximation to calculate binomial p-values.R Resources
Some good introductory material on using R can be found at: http://spider.stat.umn.edu/R/doc/manual/R-intro.html, and other pages at the same site. http://www.math.ilstu.edu/dhkim/Rstuff/Rtutor.html